Reference driver stocks
Reference drivers are available in the following stocks.

Reference driver stocks
Reference drivers are available in the following stocks.
Additional stocks for midgut study were generated in subsequent studies.
Characterization of reference drivers
To assure that the reference drivers were expressed effectively in specific intestinal cell types, we compared the expression of UAS-GFP in the presence of driver pairs to staining with antibodies detecting cell type-specific protein expression. The results are presented in detail in Ariyapala et al. (2020), but the following summarizes our results.
In general, we saw that the reference drivers were expressed well in their target cells except 1) they were all expressed in fewer cells in R3 than in other regions and 2) drivers we expected to express in all Enteroendocrine cells (R57F07.A) were expressed in a fraction of EEs.
Because EE identification was limited by our original reference drivers, we later identified and characterized a new pair of EE reference drivers (R20C06), which are described in detail in Holsopple et al. (2020). Details on both EE reference driver pairs are summarized on this page.
Panmidgut drivers
To assess expression of P{CG10116-p65.AD}attP40 and P{CG10116-GAL4.DBD}su(Hw)attP6, we combined them in the same flies and compared P{UAS-GFP.nls}8 expression to DAPI or antibody staining. Results are shown in the graph and antibody details are given in the box. Note the relatively low EE expression.
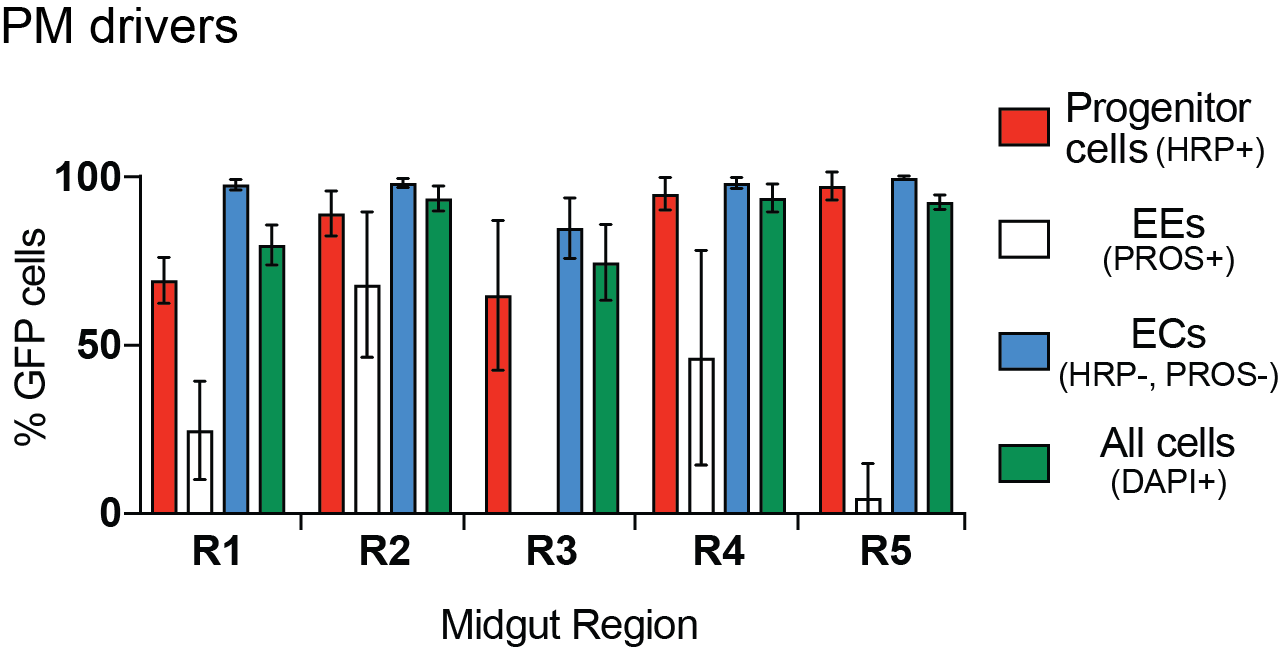
| Cell | Antibody staining criteria |
| Progenitor cells | positive for anti-Horseradish Peroxidase (HRP) |
| Enteroblasts | positive for anti-HRP AND negative for anti-Delta |
| Enterocytes | negative for anti-HRP AND anti-Prospero |
| Enteroendocrine cells | positive for anti-Prospero |
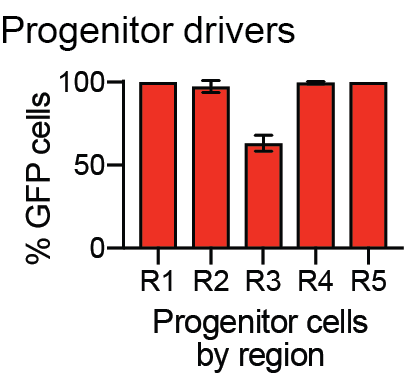
Progenitor cell drivers
Progenitor cells are intestinal stem cells and their daughter cells, the enteroblasts. We combined P{VT004241-p65.AD}attP40 and P{VT024642-GAL4.DBD}attP2 with P{UAS-Stinger}2, stained with antibodies and saw the results shown in the graph.
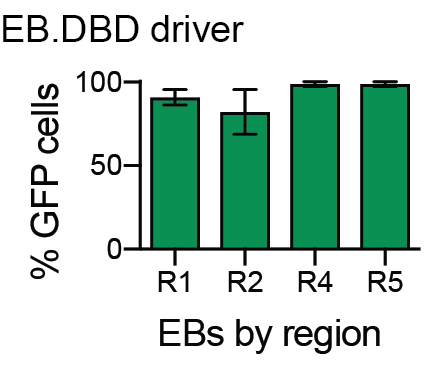
Enteroblast driver
We were able to generate only a DBD driver with enteroblast expression. We combined P{GBE-GAL4.DBD}attP2 with the panmidgut driver P{CG10116-p65.AD}attP40 and P{UAS-GFP.nls}8, stained with antibodies and saw the results shown in the graph. Negligible expression was observed in R3.
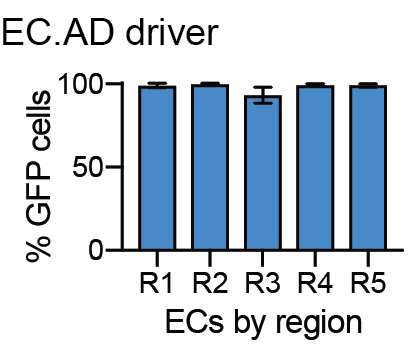
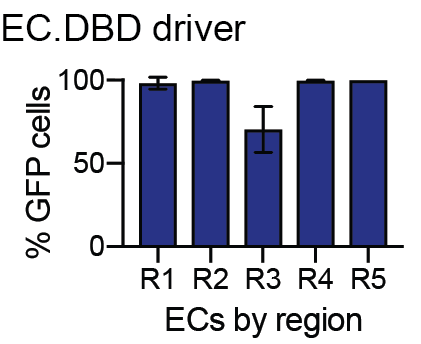
Enterocyte drivers
Flies carrying both our enterocyte-specific AD and DBD drivers died, so we assessed the drivers in crosses to panmidgut drivers. P{VT004958-p65.AD}attP40 was combined with P{CG10116-GAL4.DBD}su(Hw)attP6 and P{UAS-GFP.nls}8. P{VT004958-GAL4.DBD}attP2 was combined with P{CG10116-p65.AD}attP40 and P{UAS-GFP.nls}8. The graphs show the percentage of ECs with GFP expression in each midgut region.
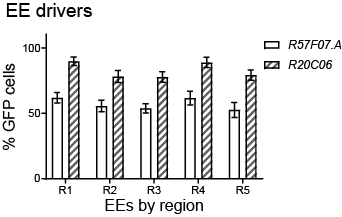
Enteroendocrine drivers
P{R57F07-p65.AD.A}attP40 and P{R57F07-GAL4.DBD.A}attP2 were combined with P{UAS-Stinger}2. P{R20C06-p65.AD}attP40 and P{R20C06-GAL4.DBD}attP2 were also combined with P{UAS-Stinger}2. The R57F07.A drivers were created and characterized in Ariyapala et al. (2020) and further characterized by Holsopple et al. (2022), along with the R20C06 drivers. The figure below compares the relative percentages of EEs detected by each driver pair.